Balancing Acts in Reel Design: Tracing Volatility Blueprints Across Slot Innovations
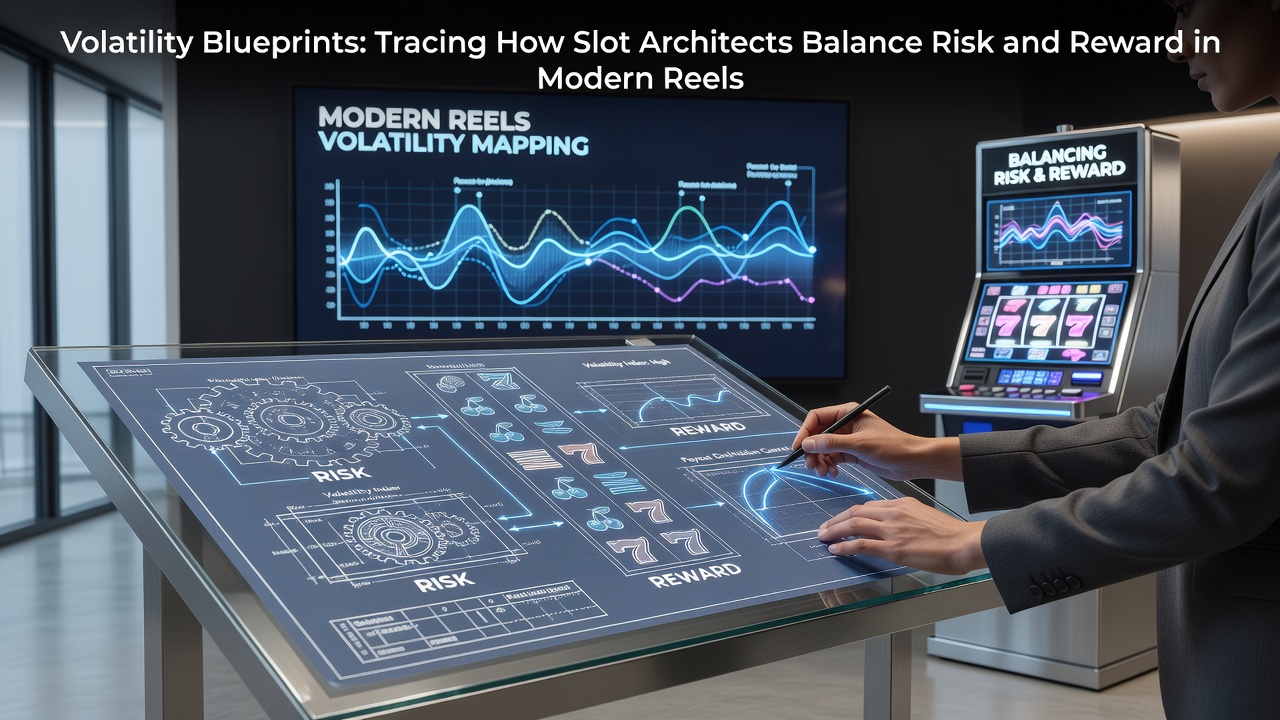
Slot architects approach volatility as a core blueprint element that shapes every reel configuration, bonus trigger, and payout distribution, and they map these patterns to create games that deliver specific risk-reward profiles for different player segments. Data from regulatory filings show that volatility calculations begin with mathematical models that set hit frequencies alongside return-to-player percentages, which together determine how often smaller wins occur versus the rarer large payouts that define high-volatility titles.
Core Metrics That Guide Volatility Planning
Engineers calculate volatility through standard deviation formulas applied to thousands of simulated spins, and these simulations reveal the spread between expected outcomes and actual results across millions of plays. Research published by the University of Nevada, Reno indicates that medium-volatility slots typically produce win rates between 25 and 35 percent per spin while maintaining RTP values near 96 percent, whereas high-volatility designs drop hit rates below 20 percent to allow for jackpot clusters that exceed 1,000 times the stake.
Design teams adjust reel strips, symbol weights, and payline structures during early prototyping stages, and they test these adjustments against historical player data sets that track session length and bet sizing patterns. One study from the Australian Gambling Research Centre found that sessions on high-volatility games average 18 percent longer when progressive jackpot meters exceed certain thresholds, which prompts architects to calibrate free-spin frequencies accordingly.
Engineering Risk Through Feature Layering
Modern reel blueprints incorporate cascading mechanics, multiplier ladders, and expanding wilds as tools that modulate volatility without altering base RTP figures, and these features allow precise control over payout curves. Architects at major studios layer bonus rounds that activate at predetermined probabilities, often between 1 in 80 and 1 in 250 spins depending on the target volatility band. This approach lets them maintain consistent mathematical return while shifting the emotional rhythm of play through delayed gratification cycles.
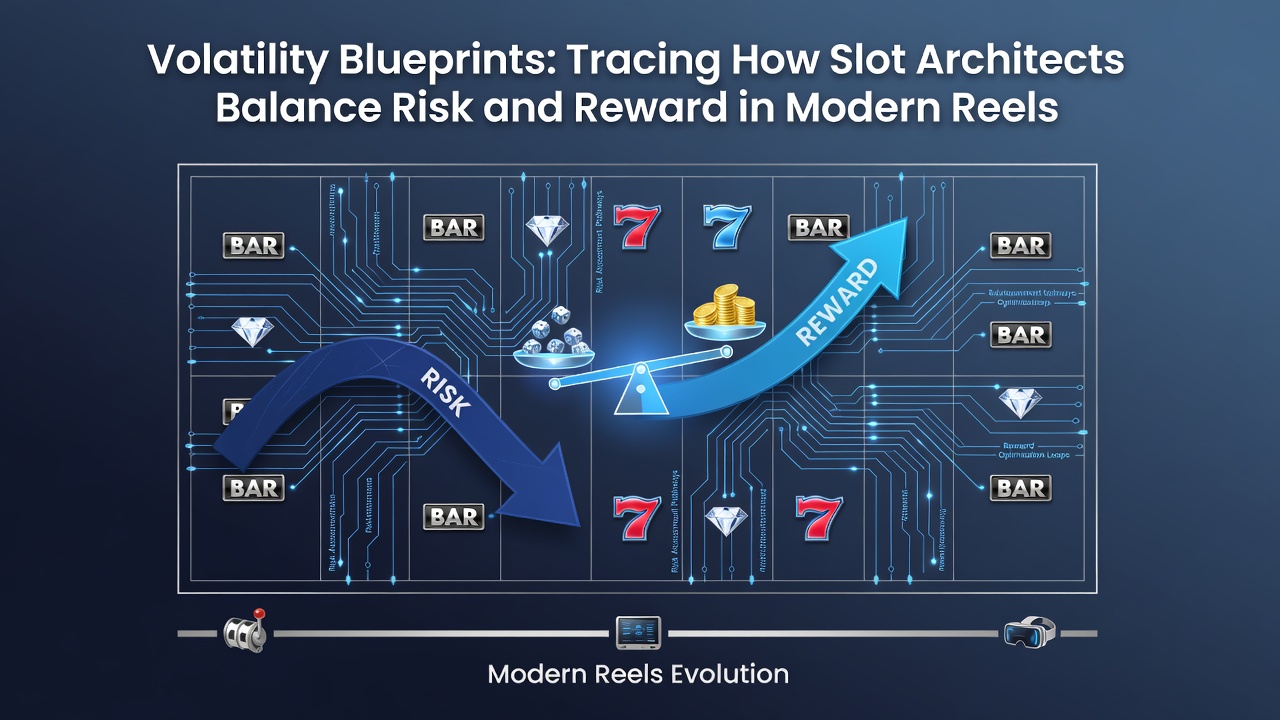
Canadian regulatory reports from the Alcohol and Gaming Commission of Ontario document that titles released in the first half of 2026 featured an average of 4.2 distinct volatility modifiers per game, up from 3.1 in comparable 2024 releases. These modifiers include retriggerable free spins, gamble options, and buy-bonus mechanics that shift effective volatility mid-session based on player choice. Engineers verify each modifier through Monte Carlo runs that exceed 10 million iterations before certification submissions.
Regional Market Influences on Blueprint Decisions
Market requirements in different jurisdictions push volatility settings toward distinct ranges, and European operators have requested more medium-volatility options since mid-2025 to align with updated responsible gaming frameworks. In contrast, North American casino floors continue to favor high-volatility progressives that drive larger average bets per spin, according to figures released by the Nevada Gaming Control Board. Architects therefore maintain multiple versions of the same core blueprint, each tuned to local player expectations and regulatory thresholds.
July 2026 saw several providers publish updated volatility white papers that detail how symbol distribution algorithms now incorporate dynamic weighting based on real-time jackpot pool sizes. These papers describe seed values that reset after each major win, which prevents predictable patterns while preserving the intended risk curve across extended play periods.
Testing Protocols and Certification Pathways
Independent testing labs require volatility reports that include minimum and maximum payout scenarios across 100,000-spin samples, and architects submit these alongside source code for RNG verification. The process identifies any deviation exceeding 0.5 percent from projected return curves, prompting iterative adjustments to reel layouts before final approval. Observers note that studios increasingly run parallel test environments that simulate both desktop and mobile play conditions to confirm identical volatility behavior across platforms.
Industry associations such as the European Gaming and Betting Association have compiled comparative datasets showing that games with three or more layered bonus features exhibit 12 percent higher session variance than simpler titles, yet they achieve equivalent long-term RTP when properly calibrated. Architects reference these datasets when deciding how many interactive elements to include in a given blueprint.
Conclusion
Volatility blueprints remain central to how slot architects translate mathematical requirements into engaging reel experiences, and ongoing refinements in simulation tools and regulatory data continue to shape these designs. Providers that document their volatility planning processes in detail demonstrate clearer pathways from initial concept to certified product, which supports consistent performance across diverse markets and player preferences.